The 3 Financial Statements, Fully Explained: What Every Analyst Needs to Know
Learn how the 3 financial statements work, how they connect, and why analysts use them to evaluate profit, cash flow, and a company’s financial position.
Posted July 18, 2025

Table of Contents
If you’re serious about a career in finance or business, understanding the three financial statements isn’t optional; it’s a baseline skill. Whether you’re preparing for an investment banking interview, building a financial model, or applying to a top MBA program, you’ll need to know how to read and connect the core statements: income statement, balance sheet, and cash flow statement.
These statements don’t just show numbers, they tell the story of how a company earns, spends, and manages money. In this guide, I’ll break down what each statement shows, how they work together, and how to use them to evaluate a company’s financial performance.
What Are the Three Core Financial Statements?
Every company, whether it’s a startup or a Fortune 500 firm, relies on three required financial statements to measure and report its financial performance: the income statement, balance sheet, and cash flow statement. These reports are essential for understanding how a business earns revenue, manages expenses, and handles its cash.
- Income Statement
- Balance Sheet
- Cash Flow Statement
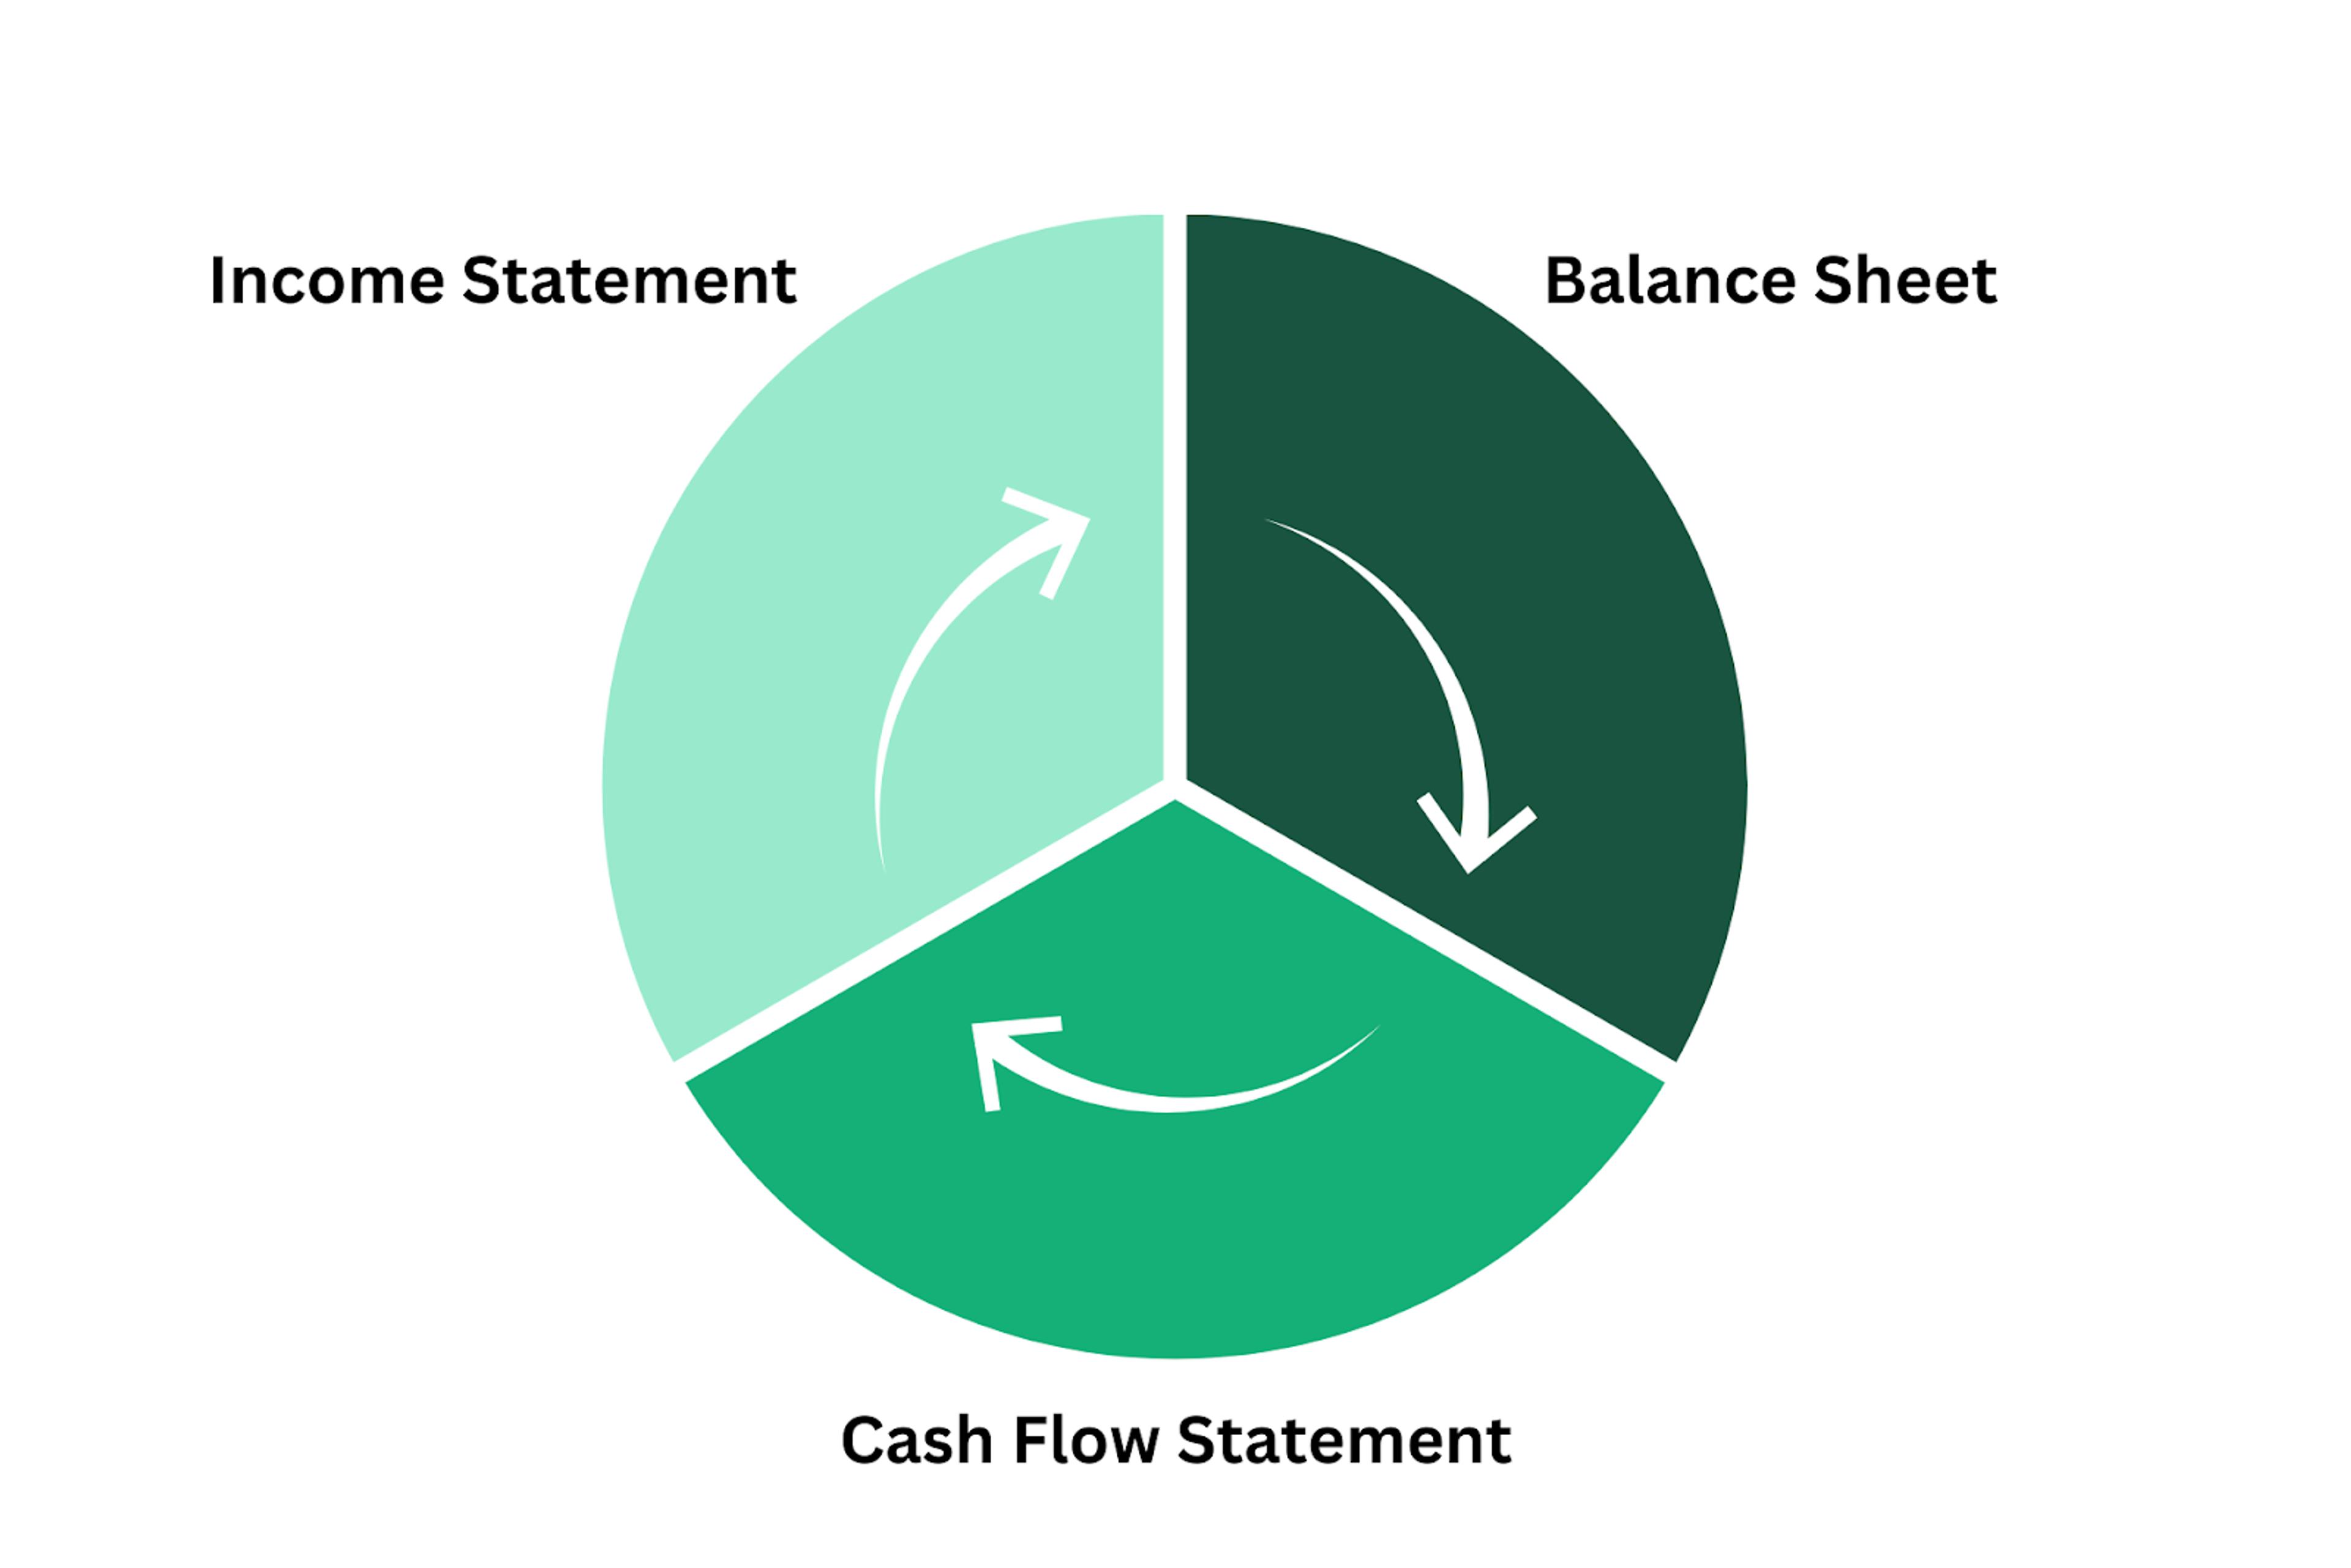
Together, these 3 financial statements provide a full picture of a company’s financial health. They help answer questions like:
- Is the company profitable?
- Does it have enough cash to cover its expenses?
- How much debt does it carry?
- What’s driving changes in performance from one period to the next?
Each statement offers a different view of the business, and analysts use them together to understand both short-term operations and long-term financial position.
Overview of the Three Basic Financial Statements
| Feature | Income Statement | Balance Sheet | Cash Flow Statement |
|---|---|---|---|
| Time Frame | Covers a period (e.g., Q1 2024) | Snapshot at a specific point in time | Covers a period (e.g., Q1 2024) |
| Purpose | Measures revenue, expenses, and net income | Shows what the company owns and owes, providing a snapshot of the company's financial position | Tracks actual cash movement |
| Key Metrics | Revenue, cost of goods sold, operating income, net income | Company’s assets, liabilities, shareholders’ equity | Cash inflows and cash outflows from operations, investing, and financing |
| Starting Point | Revenue | Cash account, business assets | Net income from the income statement |
| Ending Point | Net income | Retained earnings, total shareholders’ equity | Ending cash balance |
Why These Statements Matter
These are the main financial statements required by publicly traded companies, and they’re used in almost every form of financial modeling. Together, they give a clear view of a company’s performance over time and its ability to manage resources effectively.
- The company's income statement shows how much money the company earned and spent, and whether it turned a profit.
- The balance sheet gives insight into what the company owns (fixed assets, current assets), what it owes (accounts payable, long-term liabilities), and what’s left over for shareholders.
- The cash flow statement explains where the cash actually went, whether it was used to run daily operations, invest in equipment, or raise funds through loans or equity.
Note: For analysts, knowing how to interpret and link these reports is essential to understanding a company’s financial position, forecasting future performance, and making data-driven decisions.
The Income Statement: Tracking Profit and Loss
What the Income Statement Shows
The income statement, also known as the profit and loss statement, shows how much revenue a company brought in, what it spent to operate, and whether it generated a profit during a specific period. It’s one of the three main financial statements and a primary tool for understanding a company’s financial performance over time. This report answers a basic but critical question: Did the business make money? It does so by laying out all income and expenses, then arriving at net income, also known as the bottom line. The income statement shows activity over a set period (such as a quarter or year), not a single point in time. It’s especially useful for analyzing trends in operating income, profit margins, and cost of goods sold, providing insights into the company's operations.
All values are recorded using accrual accounting, meaning they reflect revenue when earned and expenses when incurred, regardless of when actual cash changes hands.
Components of the Income Statement
- Revenue: The total amount earned from selling goods or services. This is the top line on the income statement and the starting point for calculating profit.
- Cost of Goods Sold (COGS): Direct costs required to produce the goods or services sold during the period. For product-based companies, this includes materials and labor. For service companies, it might include direct labor costs.
- Gross Profit: Calculated as Revenue – COGS. This shows how efficiently a company produces its goods or services before considering overhead.
- Operating Expenses: Includes administrative expenses, salaries, rent, marketing, and more. These are costs not directly tied to production but necessary to run the business, representing the money a company spends on these essential activities.
- Operating Income: Also called EBIT (earnings before interest and taxes), this is the result of subtracting operating expenses from gross profit. It reflects profit from core operations.
- Interest Expense: The cost of borrowing money. This includes interest paid on loans, bonds, or other debt instruments.
- Taxes: Income tax owed based on the company’s taxable profit.
- Net Income: The final figure, net income, flows from all the activity above. This is the amount of profit or loss after all expenses, interest, and taxes have been accounted for.
Income Statement Example (Simplified)
| Line Item | Amount |
|---|---|
| Revenue | $500,000 |
| Cost of Goods Sold | $200,000 |
| Gross Profit | $300,000 |
| Operating Expenses | $100,000 |
| Operating Income | $200,000 |
| Interest Expense | $20,000 |
| Taxes | $36,000 |
| Net Income | $144,000 |
Note: The company’s income statement helps track net profit, operating strength, and return on investment. It connects directly to both the balance sheet and cash flow statement, as we’ll cover below.
The Balance Sheet: Measuring Financial Position
What the Balance Sheet Shows
The balance sheet is one of the three basic financial statements and provides a snapshot of a company’s financial position at a single point in time. Unlike the income statement or cash flow statement, which cover activity over a period, the balance sheet shows where the business stands at a specific date, usually the end of a quarter or year. It includes everything the company owns, what it owes, and what’s left for shareholders. In other words, it tracks assets, liabilities, and shareholders’ equity. The core structure follows the accounting equation:
Assets = Liabilities + Shareholders’ Equity
This equation must always balance, which is why it's called a "balance sheet." If assets don’t equal the sum of liabilities and equity, something is wrong in the books.
Main Components of the Balance Sheet
The balance sheet breaks down a company’s financial position into three sections: assets, liabilities, and shareholders’ equity. Each shows a different part of what the business owns, owes, and retains.
Assets
Assets are resources the business owns that carry economic value. They’re typically grouped as either current or long-term, depending on how quickly they can be converted into cash.
- Current assets include items the company expects to use or convert to cash within a year, such as cash, accounts receivable (money owed by customers), and inventory.
- Fixed assets, or long-term assets, are resources like property, equipment, and other tangible assets used over multiple years. These aren’t easily converted into cash but play a key role in long-term operations.
Liabilities
Liabilities represent what the company owes. They’re also split into current and long-term categories.
- Current liabilities are debts due within the next 12 months, typically accounts payable (unpaid bills to suppliers) and short-term loans or credit lines.
- Long-term liabilities include financial obligations that extend beyond a year, such as bonds payable, deferred tax liabilities, and long-term loans. These shape the company’s capital structure and borrowing strategy.
Shareholders’ Equity
This section reflects the owners' claim on the company’s assets after debts are paid. It includes:
- Retained Earnings: Accumulated profits that have not been distributed as dividends. Net income flows into this line each period.
- Paid-in Capital: Funds raised from investors in exchange for stock.
- Common Stock: Equity shares are issued by the company.
Balance Sheet Example (Simplified)
| Assets | Liabilities & Equity |
|---|---|
| Cash: $50,000 | Accounts Payable: $20,000 |
| Accounts Receivable: $30,000 | Long-Term Debt: $70,000 |
| Equipment: $100,000 | Shareholders’ Equity: $90,000 |
| Total Assets: $180,000 | Total Liabilities + Equity: $180,000 |
Note: This balance sheet example follows the standard format, where the sum of liabilities and equity exactly equals total assets, reflecting the proper application of the accounting equation at a particular point in time.
Why the Balance Sheet Matters
The balance sheet displays critical data points that help assess:
- Liquidity: How easily the company can meet short-term obligations using current assets
- Leverage: How much of the company is funded by debt vs. equity
- Financial stability: Trends in retained earnings, cash balance, and total shareholders' equity over time
Note: Analysts rely on the balance sheet and cash flow statement together to evaluate if a company has enough cash to fund operations, whether it can service debt, and how it’s managing its business assets. The next step is to look at the cash flow statement, which explains how the company’s actual cash changed over the same period.
The Cash Flow Statement: Tracking Actual Cash Movement
What the Cash Flow Statement Shows
The cash flow statement shows how actual cash moves into and out of a company during a specific period. While the income statement shows profit based on accrual accounting, the cash flow statement reveals how much cash the business truly has available to operate, invest, and pay off debts. This makes it one of the most important tools for evaluating liquidity, especially when accrual-based net income doesn’t reflect real cash inflows and cash outflows. It’s divided into three sections:
- Operating activities
- Investing activities
- Financing activities
Note: Each section shows a different source or use of cash, and together they explain changes in the company’s cash balance from the beginning to the end of the reporting period.
Three Sections of the Cash Flow Statement
Cash Flow from Operating Activities
This section shows cash generated from the company’s operations, its core business. Operating cash flow is often considered the most important part of the statement because it shows whether the business can fund itself through day-to-day activity. It begins with net income (from the income statement) and adjusts for:
- Non-cash expenses like depreciation expense
- Changes in working capital:
- Accounts receivable (customer payments not yet collected)
- Accounts payable (bills not yet paid)
- Inventory
Cash Flow from Investing Activities
This section shows how the company uses cash for long-term growth. Negative cash flow from investing is common in growth phases and doesn’t necessarily indicate financial weakness. It includes:
- Purchases or sales of fixed assets like property and equipment
- Capital expenditures (CapEx) for expanding operations
Cash Flow from Financing Activities
This section reflects changes in the company’s capital structure. This area tells you how the business is being funded, whether it's raising money or paying it back. It includes:
- Cash from issuing debt or equity
- Loan repayments
- Dividend payments to shareholders
- Stock repurchases
Cash Flow Statement Example (Simplified)
| Category | Amount |
|---|---|
| Net Income | $144,000 |
| Depreciation | $10,000 |
| Change in Accounts Receivable | -$15,000 |
| Change in Accounts Payable | $8,000 |
| Cash Flow from Operations | $147,000 |
| Capital Expenditures (CapEx) | -$40,000 |
| Cash from Investing | -$40,000 |
| Debt Issued | $50,000 |
| Cash from Financing | $50,000 |
| Net Cash Flow | $157,000 |
| Beginning Cash Balance | $50,000 |
| Ending Cash Balance | $207,000 |
Note: The ending cash balance links directly back to the balance sheet under current assets in the cash account. This connection shows how activity from the income statement and balance sheet is reflected in actual cash on hand.
Why the Cash Flow Statement Matters
The cash flow statement shows how much cash a company really generated, regardless of revenue recognition or non-cash gains and losses. It's especially valuable when evaluating:
- Whether a company has enough cash flow from operations to cover expenses
- If large capital expenditures are being funded with cash or debt
- How financing activities impact available resources
How the Three Financial Statements Work Together
To understand a company’s financial picture, it’s not enough to read each statement in isolation. The income statement, balance sheet, and cash flow statement are closely linked. Together, they show how a company earns profit, manages its resources, and moves cash through its operations, providing a comprehensive view of the company's financial position.
Linkages Between the Statements
Net income from the income statement:
- Appears as the starting point in the cash flow from operations section of the cash flow statement
- Flows into the retained earnings section of the balance sheet, increasing shareholders’ equity if the company is profitable
Changes in working capital (such as accounts receivable, inventory, and accounts payable) appear on both:
- The balance sheet, under current assets and current liabilities
- And are reflected in the operating activities section of the cash flow statement, adjusting net income to calculate real cash inflows and cash outflows
The ending cash balance on the cash flow statement:
- Becomes the new cash account on the balance sheet, under current assets
Example of How the Statements Flow Together
- A company earns $100,000 in net income during the year.
- That $100,000 becomes the starting point in cash flow from operations.
- If the company also had $10,000 in non-cash expenses (e.g., depreciation) and $5,000 increase in accounts receivable, the adjusted operating cash flow would reflect those changes.
- After all activities are accounted for, the ending cash balance calculated in the cash flow statement updates the balance sheet.
- The same net income also increases retained earnings in the shareholders' equity section of the balance sheet.
Why Analysts Rely on These Statements
Measuring Financial Performance
- Gross profit margin – how efficiently the company produces goods or services
- Operating income – profit generated from core business operations
- Net income – total earnings after all expenses, interest, and taxes
- Cash flow from operations – actual cash generated by day-to-day activity
These metrics help evaluate how well the company manages costs, grows revenue, and converts profit into a usable cash balance. If a company shows strong net income but weak cash flow, it may have problems collecting payments or managing inventory. The three core financial statements provide the foundation for understanding a company’s results. Analysts use them to calculate key performance metrics
Understand the Liquidity and Risk
- How much cash the company has on hand
- How debt levels compare to total business assets
- The timing and reliability of cash inflows and cash outflows
This is especially important for companies with large capital expenditures, significant accounts receivable, or inconsistent payment cycles. If a company relies too heavily on credit or delays vendor payments to stay afloat, that risk shows up in the statements, even if profitability looks strong. The balance sheet and cash flow statement are essential for analyzing a company’s ability to meet short-term obligations and fund long-term growth.
Making Better Business Decisions
- Evaluate investment opportunities
- Plan for funding needs
- Adjust spending and pricing strategies
- Measure the financial impact of past decisions
Whether a company is considering expansion, reducing costs, or taking on financing, these decisions rely on accurate financial data. Since all financial decisions ultimately affect revenue, cash, or capital structure, analysts depend on these statements to give them a clear, accurate view of the company’s financial position, not assumptions or estimates.
The Bottom Line
If you want to work in finance or understand how a business really works, learning the three financial statements is a must. The income statement, balance sheet, and cash flow statement each tell part of the story, but together, they show the full picture of how a company earns money, spends it, and stays financially healthy. These aren’t just tools for analysts; they’re used by anyone making smart business decisions. Whether you're preparing for a job, building a model, or trying to get into a top MBA program, knowing how to read and connect these statements gives you a real advantage.
Work With a Finance Coach Who’s Been There
Whether you're building a financial model, prepping for interviews, or applying to an MBA program, understanding the three financial statements is non-negotiable. Leland coaches include former bankers, FP&A leads, and finance pros who can help you master the skills top roles demand. Explore management consulting coaches and get one-on-one support to sharpen your skills and reach your goals faster.
Related Resources
- A Day in the Life of a Consultant – Monday to Friday (From a McKinsey BA)
- How to Get Into Consulting – Tips From Consulting Career Coaches
- Consulting Exit Opportunities: Most Popular Routes for Ex-Consultants
- Best 30 Free Resources to Get into Management Consulting
- 50+ Case Interview Questions and Examples From Top Firms
FAQs About the Three Financial Statements
What is the basic 3-statement financial model?
- A basic three-statement financial model is a tool that connects the income statement, balance sheet, and cash flow statement into one linked spreadsheet. It helps analysts forecast a company’s performance and understand how profit, cash, and capital affect each other.
What are the 4 basic financial statements?
- The four basic financial statements are the income statement, balance sheet, cash flow statement, and statement of shareholders’ equity. Together, they show how much money a company makes, what it owns and owes, how cash moves through the business, and how equity changes over time.
What are the 3 notes of financial statement?
- The three types of notes in a financial statement include accounting policies, detailed explanations of specific line items, and extra disclosures that give context. These notes help explain how the numbers were calculated and provide details that don’t appear directly on the main statements.
What are the three major types of financial?
- The three major types of financial statements are the income statement, balance sheet, and cash flow statement. They work together to show a company’s profit, financial position, and cash activity during a specific period.